
Custom Font

Custom font in tableau


Custom fonts allow us to use beautiful combinations of different fonts on our website and tools to improve typography and user experience.


How to use custom fonts in Tableau

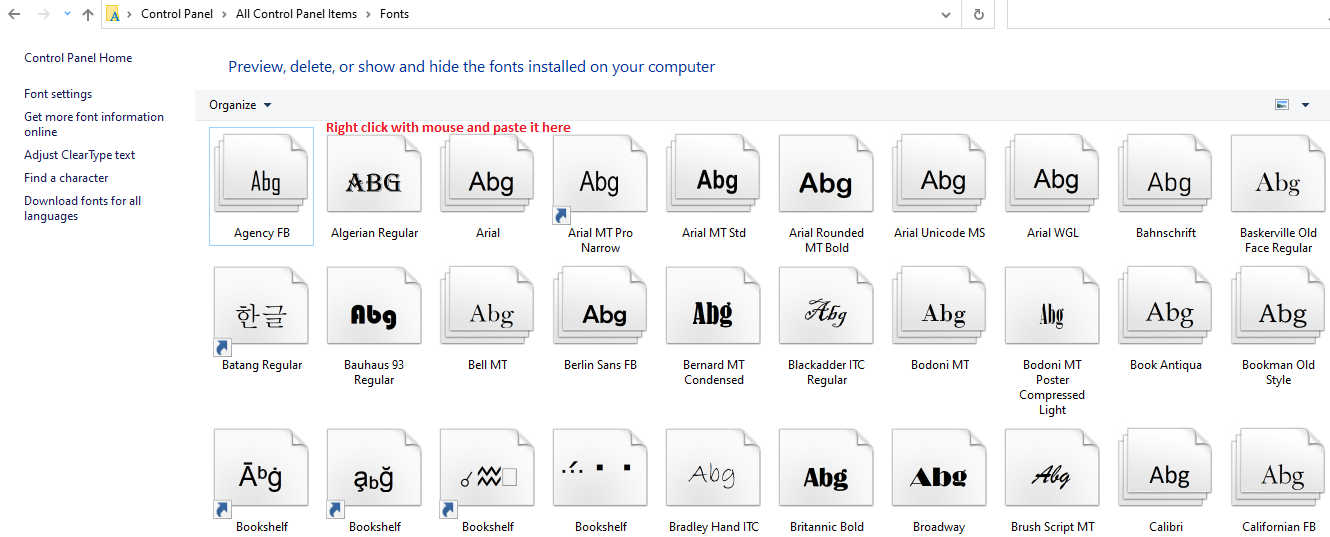
To use a custom font, you download it from the web, and copy-paste the download file into the fonts folder of control panel. After copy paste successfully, launch tableau application again, now you will be able to see new fonts in tableau application.

These are the steps to add custom fonts to Control Panel

1. Find and download the font you want to use

Here's an idea of your font will look like.


2. Search selected font in google web then download


3. Check your downloads folder, if the file is in zip extension then extract it before use.


4. After successfully extracting just copy and paste it to this location.


5. New font successfully install in your machine, just relaunch the tableau application, now you will be able to see new fonts in tableau application.

Comments

Popular posts from this blog

Difficulty and challenges

  What is bi technology? BI technology includes many tools and technologies, with the help of which we analyze the data, and on the basis of the data represent the data in the form of charts, graphs and maps etc., so that this technology can help the business user and understand the data and provide a way to grow the business as well as help business users to overcome many challenges and move forward. How can we make our career in this? Anyone can make a career in this, to make a career in BI technology, you will need these things. 1. Your way of understanding and speaking should be simple. 2. You have done college and you have good knowledge of statistics. 3. You should have knowledge of any database and you should be proficient in it. 4. You should have knowledge of web technology. 5. You should have knowledge of how do you expand the data into graphs and charts based on the data. 6. Be able to upgrade to the technology that suits the times. You can make your career in BI on the ...

Web data connector

Tableau is a powerful data visualization tool that allows you to connect to and analyze data from various sources, including web data. In this blog, we will focus on the web data connector feature in Tableau, and how it can help you connect to web-based data sources and create interactive dashboards. What is Web Data Connector in Tableau? The web data connector in Tableau is a feature that allows you to connect to data from web-based sources that are not supported by default connectors in Tableau. With the web data connector, you can create custom connections to web-based data sources, including APIs, JSON files, and other web-based data sources. Why Use Web Data Connector in Tableau? The web data connector allows you to access a wide range of web-based data sources that are not natively supported in Tableau. This includes data from social media platforms, news sites, weather APIs, and other web-based data sources. By using the web data connector, you can easily integrate web-based dat...

Filter In Tableau

 Tableau Filter Tableau is a powerful data visualization tool that allows you to create interactive dashboards and reports. One of the key features of Tableau is the ability to filter data in real-time, making it easy to drill down into specific data points and get insights quickly. In this blog, we will focus on the filter feature in Tableau and how it can help you analyze your data more efficiently. What is Filter in Tableau? Filters are a way to refine the data displayed in a visualization. They allow you to control which data is displayed in the view, based on the criteria you specify. You can use filters to exclude or include data, change the date range, filter data by region or category, or any other criteria that makes sense for your data analysis. Tableau offers a range of filter types to suit your needs, including: - Dimension Filters: These filters are used to filter data based on the values in a specific dimension. For example, if you have a sales dashboard, you can use ...